
Validate your PostHog setup
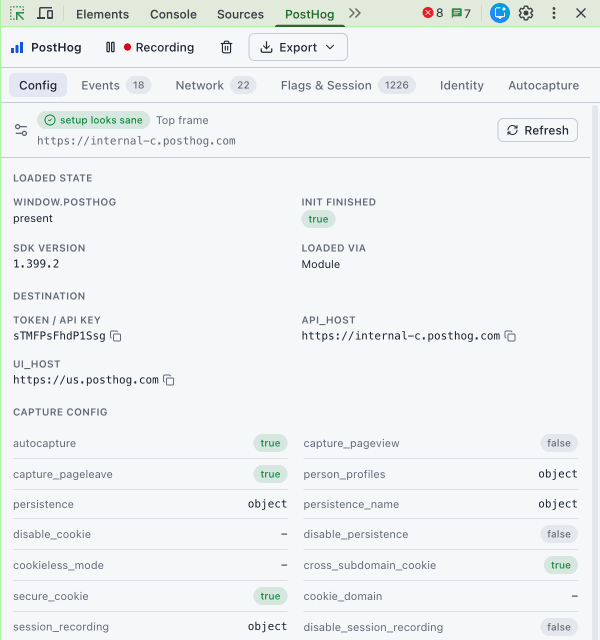
Check SDK status, destination, consent, identity, and capture settings at a glance.

PostHog Debugger is an unofficial browser extension that adds a PostHog panel to Chrome and Firefox DevTools. It inspects supported events, SDK configuration, identity, feature flags, replay, and network delivery locally while you test—without requiring a PostHog login.
Compare debugging workflows
Browser Network tools, the official PostHog Toolbar, and PostHog Debugger answer different questions. Use them together when a problem crosses the page, SDK, and delivery path.
| Compare | Browser Network toolsThe browser's general-purpose request and response inspector. | Official PostHog ToolbarPostHog's authenticated overlay for product data and workflows. | PostHog DebuggerAn unofficial, local DevTools panel focused on PostHog diagnostics. |
|---|---|---|---|
| Login required | No. | Yes. Launch it with access to a PostHog project and an authorized site. | No PostHog login. |
| Decoded payloads | Shows raw request bodies; decoding batches and encoded payloads is manual. | Its event debugger shows captured events, properties, and copyable event JSON. | Decodes supported JSON, batches, form data, base64, and gzip into an event view. |
| SDK configuration and identity | Limited to evidence visible in requests, browser storage, or console inspection. | Focused on actions, heatmaps, flags, and event debugging rather than a dedicated SDK-state view. | Dedicated Config and Identity views when the page exposes a compatible SDK, plus partial traffic-derived evidence. |
| Network diagnostics | The most complete general view of URLs, headers, timing, initiators, and responses. | Event-centric; it is not a request-delivery diagnostic view. | Correlates PostHog-shaped events and requests, highlighting status, size, timing, blocking, and non-2xx delivery. |
| Best use case | Low-level browser or transport diagnosis across any request. | Official actions, heatmaps, feature-flag overrides, and event inspection on an authorized site. | Local, no-login PostHog diagnosis across payloads, SDK state, identity, flags, replay, and delivery. |
Check SDK status, destination, consent, identity, and capture settings at a glance.
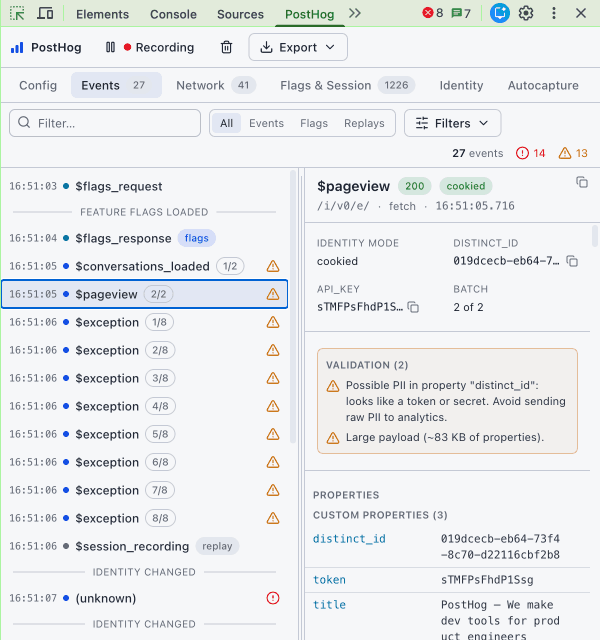
Review payloads, properties, and validation warnings in real time.
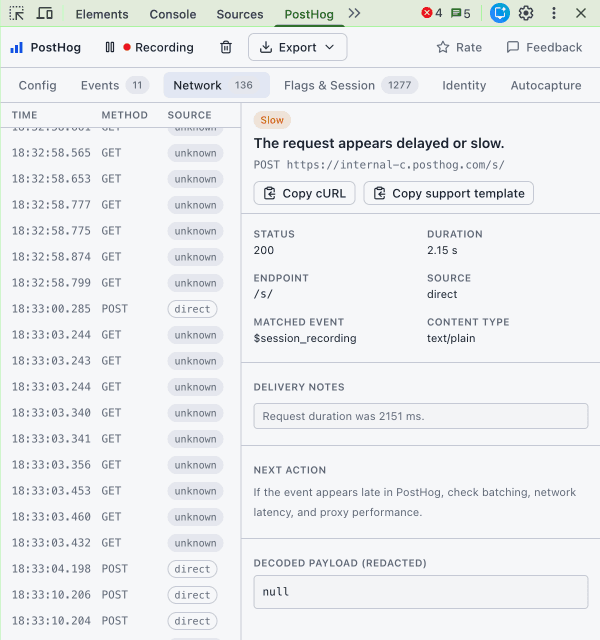
Match events to network requests, spot failures, and export JSON or HAR for support.
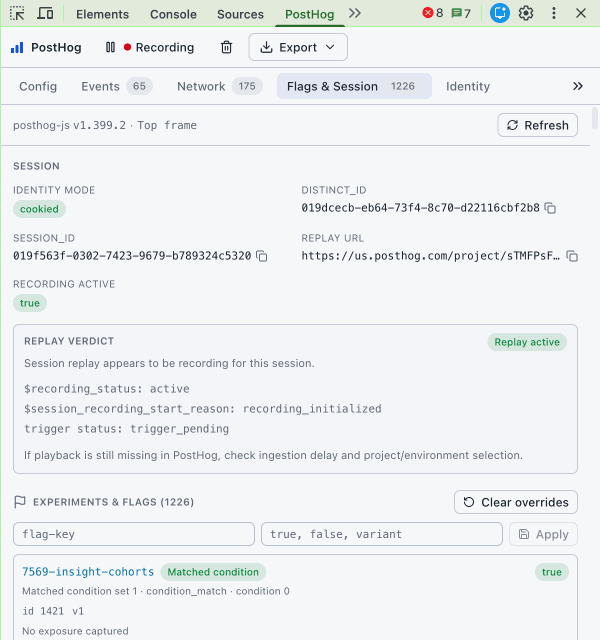
Check active flags, payloads, overrides, session IDs, and replay status.
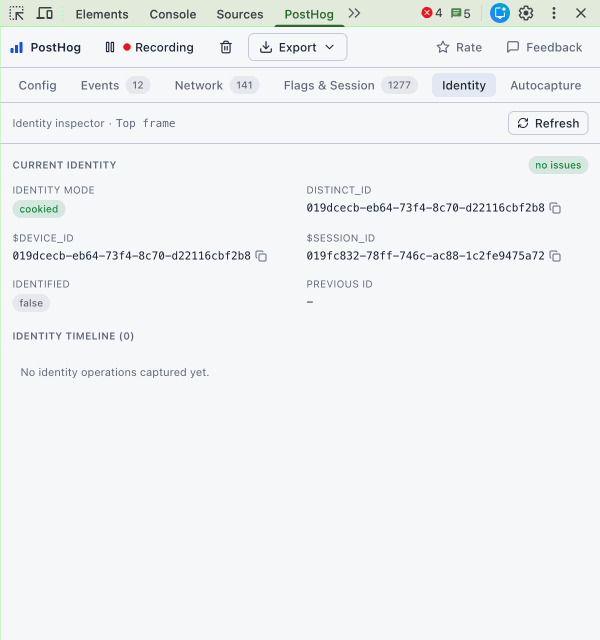
See distinct and device IDs, groups, and identify, alias, or reset activity.
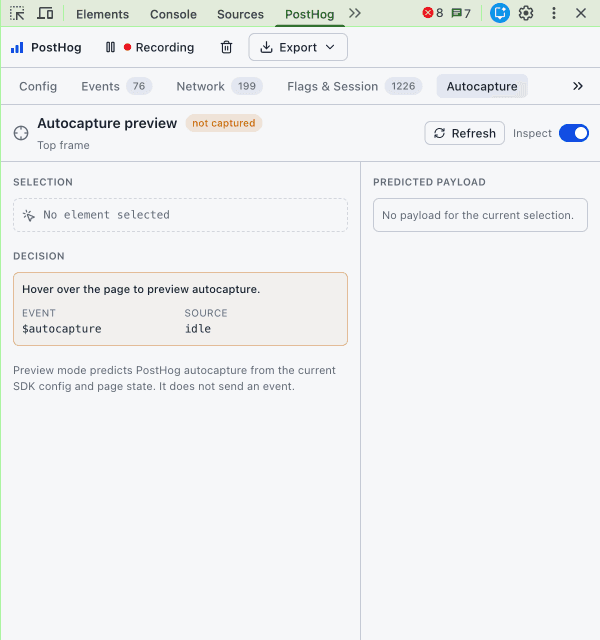
Inspect the predicted event and properties without sending an autocapture event.
Frequently asked questions
No. PostHog Debugger is an independent, unofficial project. It is not affiliated with, endorsed by, or sponsored by PostHog.
No. The extension observes the inspected page and its PostHog-shaped browser traffic without authenticating to PostHog. It cannot prove which private project owns a token or inspect private project settings. Read the detection limits.
PostHog Debugger processes inspected event payloads, SDK state, identities, flags, and request evidence locally in memory. Separate cookieless usage analytics is limited to allowlisted product-interaction categories and excludes inspected URLs, event names, properties, payloads, identities, and flag keys. Read the privacy policy.
PostHog Debugger supports Chrome 111+ and compatible Chromium desktop browsers, plus Firefox 140+ on desktop. It is a DevTools extension, not a mobile browser extension. Chrome Web Store. Firefox Add-ons.
It recognizes common PostHog endpoint shapes across Cloud, reverse-proxied, and self-hosted setups. A custom path rewrite can remain unclassified even when the request succeeds, and the extension cannot inspect proxy logs, server health, queues, or storage. Review supported endpoint shapes.
Open DevTools and the PostHog panel before reloading the page, then confirm capture is not paused and filters are clear. Missing data can also come from consent, blockers, restricted pages or frames, an unreadable SDK instance, unsupported encoding, or a custom endpoint shape. Follow the events-not-showing checklist.
Documentation and downloads
Inspect PostHog configuration, events, identities, and network delivery in DevTools while you test a flow